
Welcome › Forums › For Tutors: Discussion of UK Training, Syllabus and Exams › Club-based Exam Stats › Reply To: Club-based Exam Stats
26 January 2022 at 00:14
#956
Keymaster
Hi Peter,
I’ve crunched the 2018 vs 2021 demographic data – here’s the graph
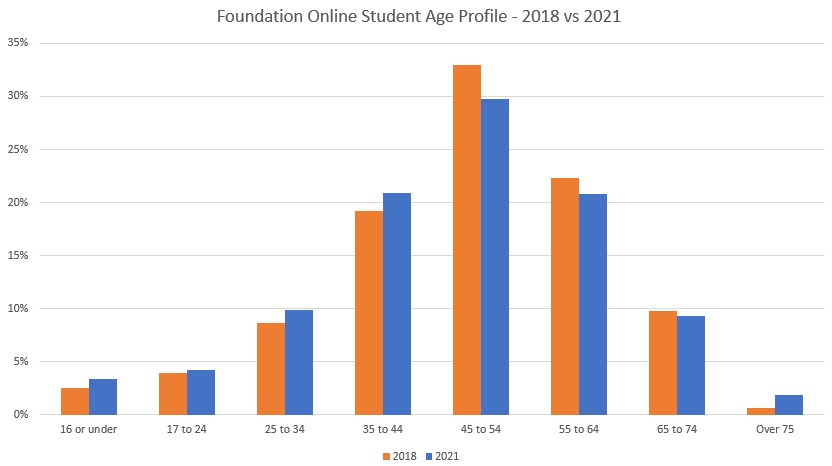
	        2018	2021
16 or under	2.5%	3.4%
17 to 24	3.9%	4.2%
25 to 34	8.6%	9.9%
35 to 44	19.2%	20.9%
45 to 54	32.9%	29.8%
55 to 64	22.4%	20.8%
65 to 74	9.8%	9.3%
Over 75	        0.6%	1.8%
If it’s helpful, here are the RSGB’s 2018 and 2020 numbers (no 2021 numbers as yet):
	2018	2020
0-14	5.0%	2.8%
15-19	5.9%	3.4%
20-29	7.7%	7.3%
30-49	12.0%	16.2%
40-49	20.4%	21.9%
50-59	25.6%	31.3%
60-69	17.4%	13.7%
70-79	5.5%	3.3%
80+	0.5%	0.2%
Hopefully of interest…
Pete
-
This reply was modified 2 years, 9 months ago by
Pete M0PSX.
